Follow verified analysts.
Every trade.
Stop following opinions. Start following proof. Below: the Tradefeed — every verified trade, straight from the brokerage, with the thesis behind it.
An example Tradefeed, not the live one — the analysts and trades in it were written for this exhibit, and time is compressed. Everything around them is the product itself: this is how the Tradefeed renders a trade, as each sync lands.
You're trusting people you can not verify
— and motives you can not see.
The internet is full of confident calls from people you can't verify, with reasons you can't know. Three questions take the whole thing apart.
X, YouTube, Discord — No way to know.Anonymous accounts, AI photos, bought followers. Someone with $10K posting like they manage millions. $5M or $500? You will never know.
Piggyback — Verified.Positions and trades are read from a connected brokerage — never typed in, never self-reported.
X, YouTube, Discord — You can't tell.Conviction — or exit liquidity, a course funnel, a referral code. The motive never shows.
Piggyback — They own it.The thesis sits next to the live position it describes — weight and P&L on the record. The motive is the position.
X, YouTube, Discord — Deleted.Losers vanish, winners get reposted. A highlight reel dressed up as a track record.
Piggyback — Still on the Tradefeed.Every version preserved, every trim recorded, every red day in its card. Nothing is silently edited.
Piggyback's answer to all three is the same thing: the account, attached.
This is what proof looks like.
Here is what a subscription opens: one verified analyst profile as a subscriber sees it — nothing locked, the whole desk open. The sections below take it apart.

An example profile, not a live page — the posts in it were written for this exhibit. Everything around them is the product itself, rendered as a subscriber sees it.
A thesis that doesn't rot.
Most research is a PDF that ages. On Piggyback a thesis is a living object — the call, the corridor it draws around the price, every revision, and the trades that back it, in one place. Below: one real thesis, as subscribers see it.
The call, in writing
Stance, conviction, horizon, and the case — published next to the live position it describes.
The verified position strip under the summary isn't decoration. Weight, unrealized P&L, and the last sync are read from the analyst's connected brokerage — so the words and the money are on the same page.

BE: the AI buildout is power-starved. Bloom sells time.
Interconnect queues are measured in years; Bloom deploys in months, and AI labs pay for electrons now. Revenue tripled into the first $1B quarter — the multiple is the risk, so I trade it on rails.
- Quarterly backlog + deployment pace prints
- FY26 guide raises (rev + EPS path)
- New hyperscaler / AI-lab fleet orders
- Brookfield framework drawdowns (financing validation)
- AI-capex digestion pauses orders - multiple compresses first
- Gas turbines + rivals close the time-to-power gap
- Natural-gas price spikes squeeze customer economics
- Capacity-ramp execution while margins hold
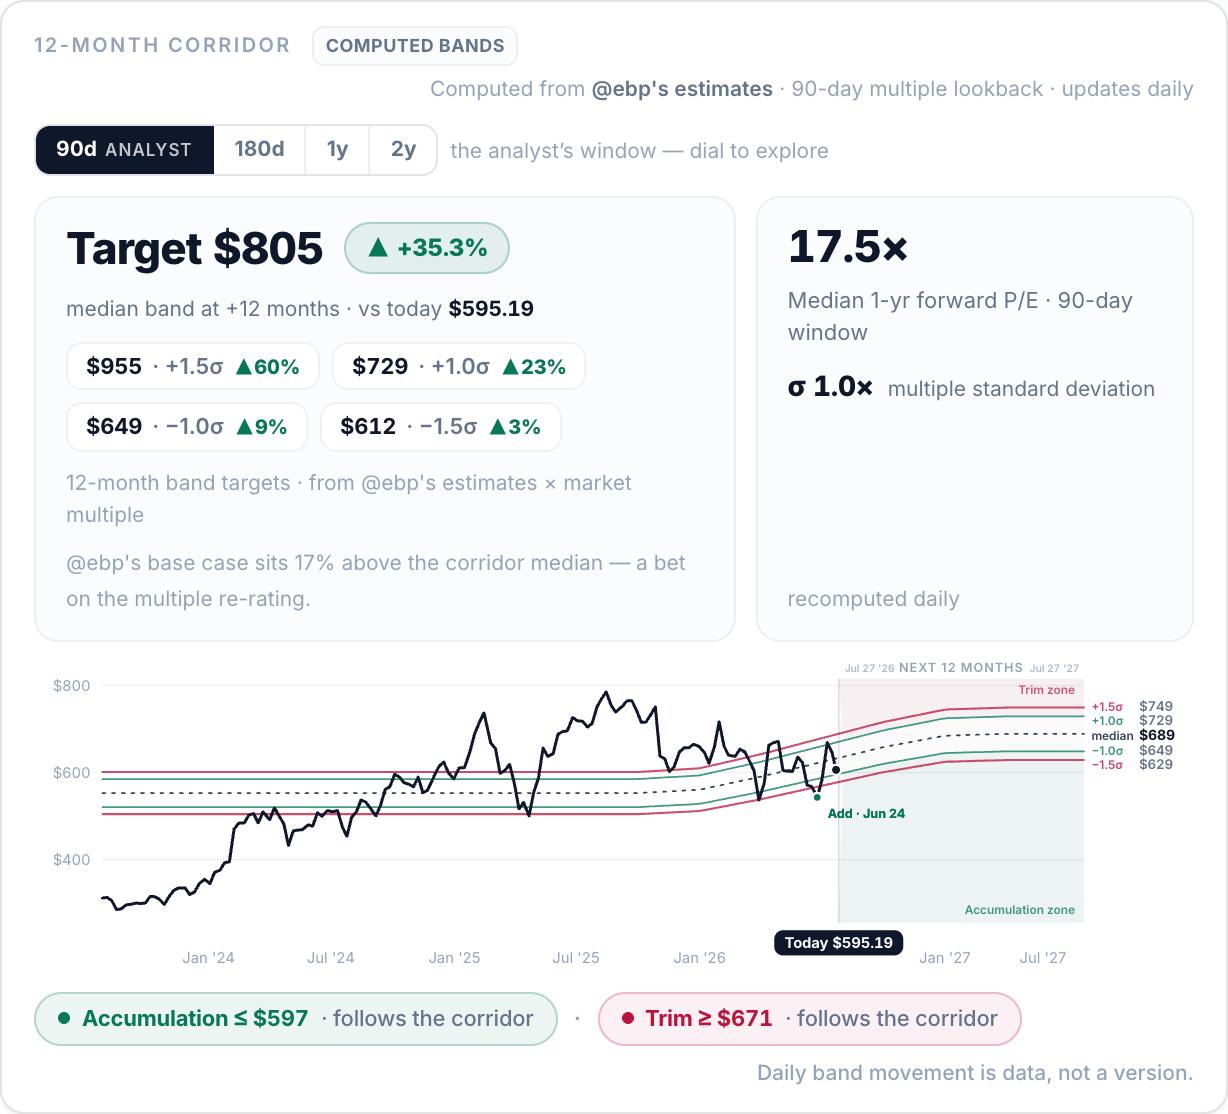
The corridor, recomputed daily
The analyst's own estimates draw a valuation corridor around the price — recomputed every day as the price and the estimates move. Estimates get revised at earnings; the bands move with them, on the record.
Dial the lookback — the analyst's chosen window is marked. The zones below are the levels they said they'd act at, published before the price tested them. Daily band movement is data, not a version.
Nothing silently edited
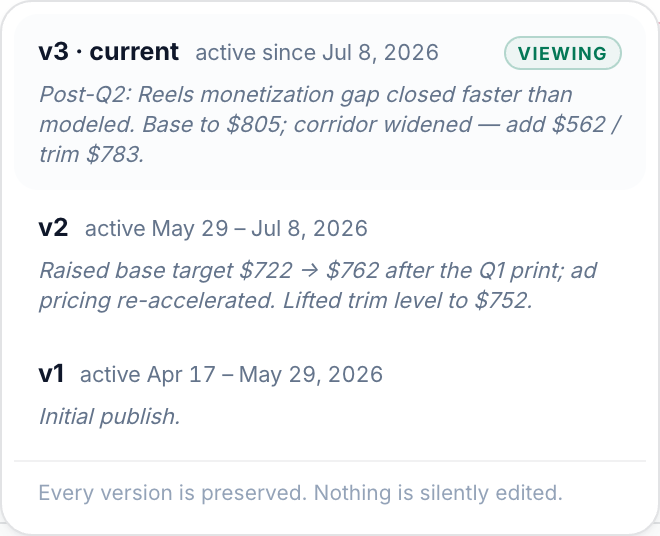
Every revision is a version. v1, v2, v3 — each preserved with what changed and when, including the targets that moved. The current call always carries its history.
When a thesis updates, it lands in the feed as an event — subscribers see the revision the day it's made.


The plan, then the trade — Jun 23 the price enters the published window, Jun 24 the verified add syncs from the brokerage.
The Tradefeed answers
When price enters a zone the analyst put in writing, it becomes an event on the record — and the trade that follows syncs from the brokerage, so the thesis and the trades prove each other.
One object, kept honest in both directions. The estimates are revised at earnings, the corridor is recomputed daily, and every add or trim lands on the record at the next sync — as fast as the brokerage makes the trade available.
Every trade, on the record
— synced daily.
Each trading day closes into one card: the trades, the damage or the gain, and the analyst's own words — synced from the brokerage, never typed in.
A trade happens
The analyst buys or sells in their own account, at their broker. Piggyback isn't in the loop.
Read, not written
A read-only connection picks the trade up once the brokerage makes it available. Piggyback can never place a trade or move money.
The trade lands, timestamped
Exact ticker, quantity, and price go on the analyst's record at the sync that catches them — losers included.
Investors see it
The trade hits the feed and the day card — with the analyst's own note attached.
Zero self-reported trades.
There is exactly one way onto the Tradefeed: a trade in a connected brokerage account. If it's on Piggyback, it happened.
Three steps, no leap of faith.
Browse verified analysts
Every profile is broker-synced: positions, weights, P&L, and the full record — losers included.
Check the record, free
Every profile shows its verified stats — returns, green positions, the price-free event timeline — before you pay a cent. No credit card.
Subscribe for the work
Full theses, corridor levels, exact trades, and every day card — from the analysts you choose. Cancel anytime.
Follow verified analysts. Or become one.
See who is real. Show your proof.
Follow analysts you can verify.
Real portfolios, not screenshotsPositions, weights, and P&L are read from a connected brokerage — never self-reported.
Verified trades, synced dailyTrades land on the record timestamped, as fast as the brokerage makes them available — with the analyst's reasoning attached.
The proof is public — the work is for subscribersEvery profile shows its verified stats: returns, green positions, the price-free event timeline. The work — theses, corridor levels, exact trades, and day cards — comes with a subscription.
Start free — no credit card required
Your portfolio is your proof. Get paid for your transparency.
Verification is a read-only connectionLink your brokerage via SnapTrade in 2 minutes — verified at the source, because the positions and trades are read from the account itself. Piggyback can never place a trade or move money.
The thesis does the talkingWrite the call, targets, and levels — the corridor recomputes daily and your trades stream automatically.
The economics are yoursSet your own price — $50/mo floor. You keep 80%, paid out via Stripe.
Connect in 2 minutes · You keep 80%
You set the price. You keep 80%.
Your research, your subscribers, your terms. Piggyback runs the verification and the plumbing.
The floor, not the price
You set your own subscription price — $50 a month is simply the minimum. Serious research doesn't price like a newsletter.
Your share of subscriptions
You keep 80% of what your subscribers pay. No tiers, no thresholds, no fine print.
Payouts, handled
Subscriptions are billed and paid out via Stripe — the same rails the rest of the internet trusts.
The math, at the floor: 100 subscribers × $50 = $5,000/mo — $4,000 of it yours.Arithmetic, not a projection — your price and your audience are up to you.
Analysts can't fake it. We can't touch it.
The connection that verifies the record is the same one that keeps everyone safe: read-only, at the source.
Logins never touch Piggyback
Brokerage credentials are entered with the brokerage, inside SnapTrade's connection flow. Piggyback never sees, stores, or handles them.
Read-only, text-based data
Piggyback receives read-only, text-based position and trade data — tickers, quantities, prices, timestamps. It cannot place trades or move money.
A SOC 2 Type II audited partner
Brokerage logins are handled by SnapTrade, a SOC 2 Type II audited data partner built for exactly this job.
Verified means broker-synced
The badge means positions and trades are read from the account — not screenshots, not a form an analyst filled in.
Every record is dated
Every profile carries the time of its last brokerage sync, and every trade and revision is timestamped — so you can always see how current a record is.
Prices are context
Trades, positions and weights come straight from the brokerage record. Market charts and quotes are context, and may be delayed.
FAQs
Straight answers — including the ones about what we can't do.
How does verification work — and how fast do trades appear?
An analyst links their brokerage through SnapTrade's connection flow. From then on, positions and trades are read from the account — read-only — and the profile carries the time of its last sync. Verified means broker-synced, never self-reported. No analyst can type a trade in; the record is written by the sync. Trades sync daily: how fast a trade appears depends on when the brokerage makes it available — some land the same day, others the next day or the day after. We say synced, not "real time", because that's the truth.
What does it cost?
Browsing is free — no credit card, no trial clock. Each analyst sets their own subscription price, with a $50/mo floor: serious research doesn't price like a newsletter. The one exception is the founder's own profile, priced at $10/mo before the floor existed and left there. A subscription buys the work: complete daily updates, every verified trade with the price it filled at, corridor levels, and the thesis behind them. Cancel anytime — you keep access through the period you've paid for; the remaining time isn't refunded.
What do I get without paying?
A verified analyst's profile is public: the badge, the sync stamp, how many positions they hold, their week and month returns, how many positions are green, and the price-free Tradefeed. The work is the paid part — everything the analyst writes, the thesis and its targets, corridor levels, day cards, and every verified trade. Analysts choose how much of that stats layer to show, so it varies.
Do I see dollar values or percentages?
By default an analyst's position sizes show as percentages — position weight, day P&L, unrealized P&L, and a portfolio curve indexed to 100 rather than to a balance. Prices are never hidden: trade prices, thesis targets and corridor levels are market data and always show in dollars. An analyst can opt into showing dollar position sizes and share counts too. Either way the math is just as checkable, and weights are what you'd size against your own book anyway.
What is the corridor?
A valuation band computed from the analyst's own published estimates, recomputed daily as price and estimates move. It shows where today's price sits against their scenarios — and the accumulation and trim levels they said they'd act at, published before the price tested them, so you can check the trades against the levels.
What happens if an analyst disconnects their brokerage?
The sync stops and verification pauses. The positions stay on the profile, frozen at the last sync, with the time of that sync shown — so you can see exactly how current the record is. Nothing already verified is removed: trades on the record are never deleted when a connection ends. A profile that isn't syncing can't show you a current position, and it will say so.
How do I find analysts?
Discover lists every analyst verified on Piggyback — returns, position count, how much of the book is green, and price, read from the same brokerages so you can compare like for like. We're deliberately not publishing a ranking: with a roster this small, a ranking would say more about the sample than the analysts.
How do analysts get paid?
Subscribers are billed through Stripe and the money routes to the analyst's own Stripe account — you keep 80% of the gross, and card-processing fees come out of Piggyback's 20%, not yours. Payouts run daily on a rolling ~7-day delay once Stripe onboarding is done. Stripe handles identity, bank details and tax forms; we never see them. If a subscriber charges back or is refunded, your 80% of that charge reverses too.
What does it cost to become an analyst?
Nothing up front. No listing fee, no monthly charge — our only revenue from you is the 20%. Connect your brokerage read-only, set your price, finish Stripe's payout onboarding. Verification is last, and it's done by us, by hand: connecting an account starts the sync, but a person confirms the profile before the badge goes on.
Is this investment advice?
No. Piggyback publishes verified history — what analysts actually hold and trade, with their reasoning attached. There are no signals, no ratings, no ranking, and nothing copies a trade into your account. What you do with an analyst's record is your call. Past performance does not guarantee future results.
I built Piggyback because I was tired of doing due diligence on strangers' screenshots. Somewhere between the third deleted loser and the fourth course funnel, the question stopped being “who's right?” and became “who's even real?”
So the rule here is simple, and it applies to me first: my own portfolio is on the record, under the same verification as every analyst on the site — every position, every trade, every revision, synced from the brokerage. If I wouldn't put my own record under these rules, I wouldn't ask anyone else to.
— Eric, founder